
Welcome to our sleep data tips part two to learn more about recovery (HRV) data! Even if you do not use our tracker, I hope reading this will help you understand more about tracking sleep and why it’s so beneficial! I have written about this topic before, but since our app has changed quite a lot since then. That’s why I thought this would be a welcome topic at this point of time.
Heart rate variability (HRV) is commonly used to measure recovery. It offers especially athletes an effective measure of their ability to do their next workout. HRV gives insight into how well the parasympathetic nervous system (PNS) works. PNS is one part of the autonomic nervous system (ANS). It stimulates the “rest-and-digest” and “feed and breed” activities that happen when the body is at rest. It is complementary to the sympathetic nervous system (SNS), the other part of ANS. The SNS is responsible for stimulating activities associated with the fight-or-flight response.
We have more than just one recovery graph to give you a deeper understanding of your personal recovery and readiness for strain and stress. There’s HRV RMSSD, total recovery, integrated recovery and autonomic nervous system balance. This may sound like a lot and studying all the data may seem like a daunting task, but that’s why I’m here! I want to give you some tips on how to read and use this data to your own advantage. Who knows, maybe you’ll learn something new!

Heart Rate Variability RMSSD
First, we have HRV RMSSD*, (Root Mean Square of Successive Differences), one of the most widely used time domain values of heart rate variability. It tells about the activity of the central nervous system. A higher number indicates better recovery and lower stress, for example.
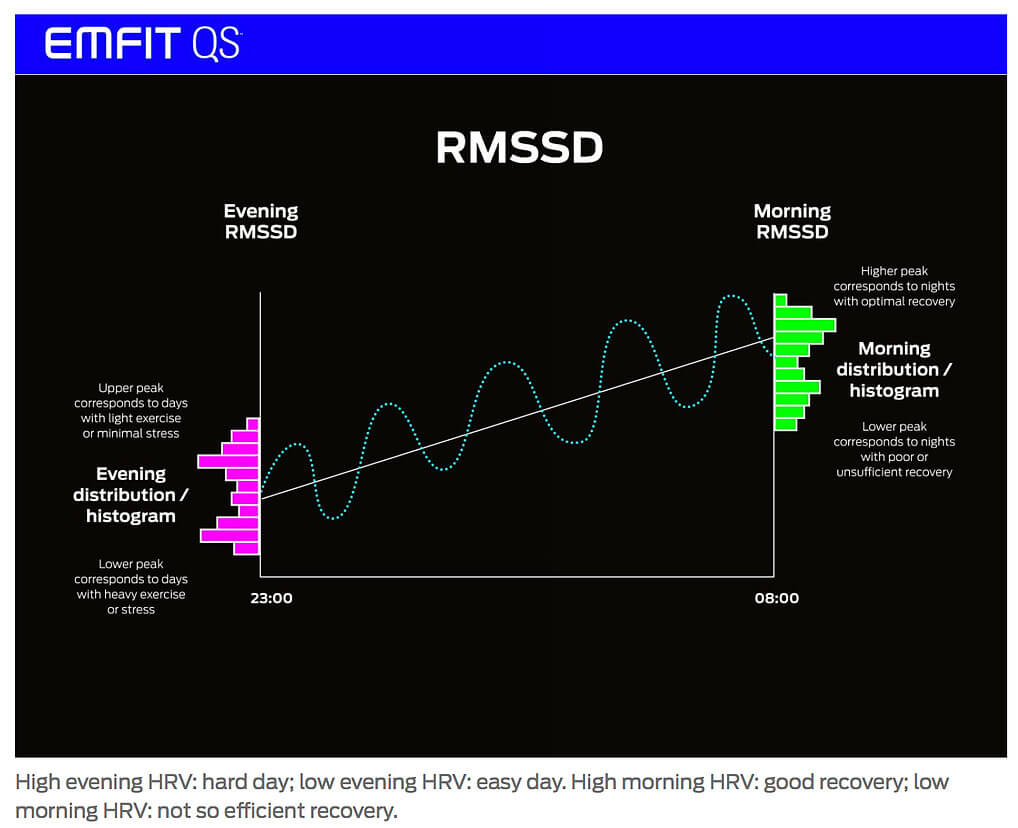
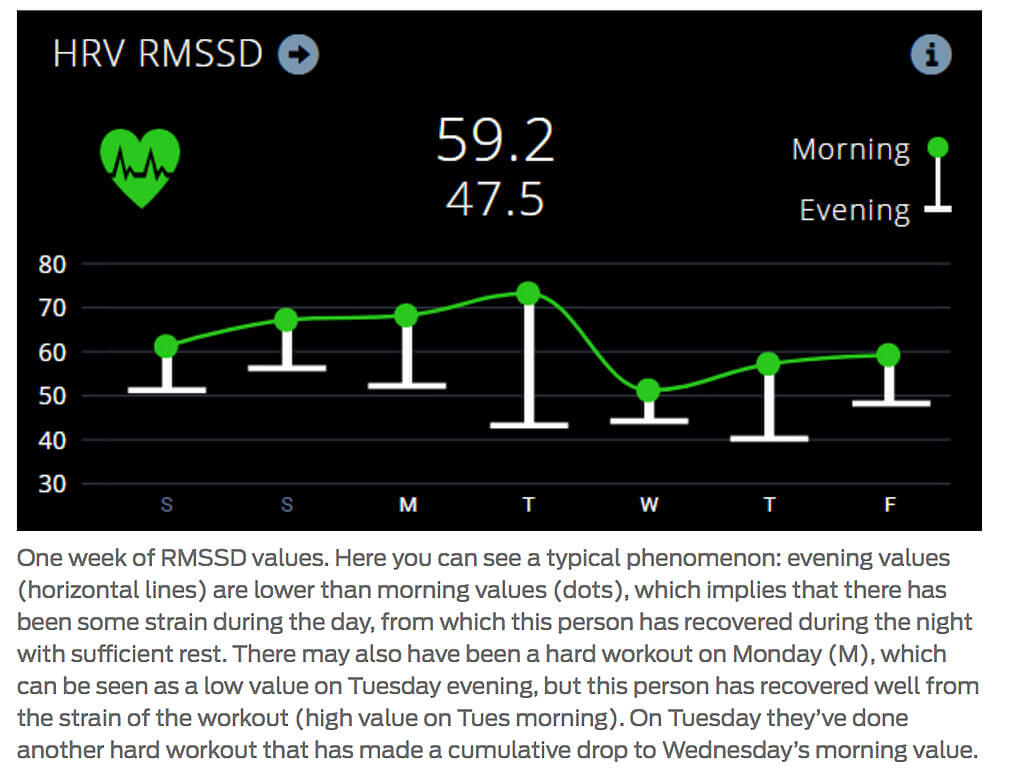
Our app shows both evening and morning values of HRV RMSSD**. A low evening value means that your day has been hard because of either mental stress or physical exercise. Thus, athletes can use the evening value to check whether or not their training has been effective. The morning value should be higher than evening value, meaning that there has been efficient recovery and rest during the night. This shows how ready and well rested your body is for a new day.
For efficient recovery from training and stress, it is essential that the parasympathetic nervous system is active and your body gets sufficient rest. With the HRV RMSSD value you can keep track of what your general baseline value is and see how hard workouts, stress and other factors like this influence it. When the value goes back to your baseline, you should be capable of doing an another heavy workout.
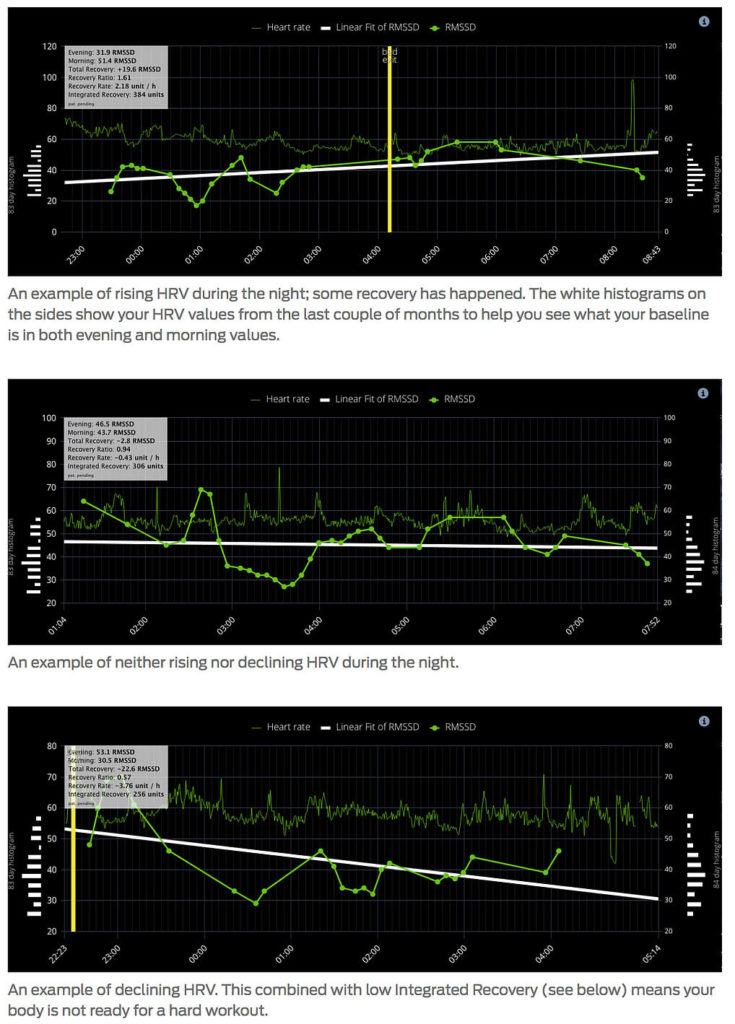
RMSSD can be measured in time windows of different lengths and in different positions, like sitting or standing. The RMSSD value is highly individual and depends on age, gender, fitness level, stress level and lifestyle choices, among others. This is why it is smarter to measure your own HRV for a few weeks and only after that make conclusions on what kind of implications different values might have. It should also be noted that the short 1-3-minute morning measurements are pretty flexible. You might get very varying results if you did it many times in a row. This means that one number may tell you to rest and another may encourage you to do a hard workout. That is why it’s wiser to measure HRV throughout the whole night in short time windows. This way you can see the development (or trend) of all the results.
Generally, higher values indicate for example better health and fitness. In the short term, RMSSD indicates readiness for the day. In the long term, for example along with training, RMSSD values tend to increase (which is a good thing). Long term decrease in RMSSD may be a warning of an approaching over training condition or some other malfunction in your body.
*Mathematically, HRV RMSSD is the square root of the mean of the squares of the successive differences between adjacent heart’s beat-to-beat intervals.
** The morning HRV RMSSD value we use is the average of all 3-minute time window values measured during the last 90 minutes prior to waking up. The evening value is similarly measured within the first 90 minutes in bed.
Total Recovery
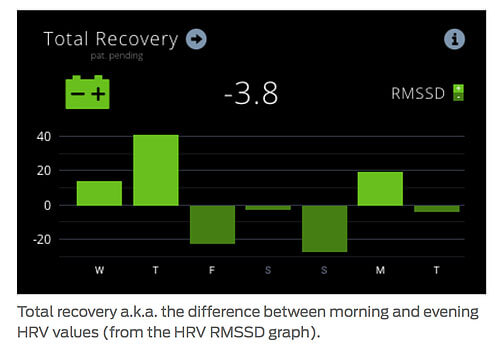
Next up we have Total Recovery, which simply is the difference between morning and evening HRV RMSSD values. Usually this value should be positive, indicating that you have got enough rest during the night to allow your body to recover. However, you should look at this with regard to the activities of the day before. If you had a very easy and light day (no stress and no heavy exercise) and your evening RMSSD was relatively high, it is not even reasonable to expect a high total recovery value. It is just that here simply is no stress or strain to recover from.
Remember that recovery values are highly individual. Everyone has their own baseline values and you should compare yours to your own baseline values. It is also wise to compare your own morning values to your evening values, which is why we’re about to take a look at another graph that does just that.
Integrated Recovery
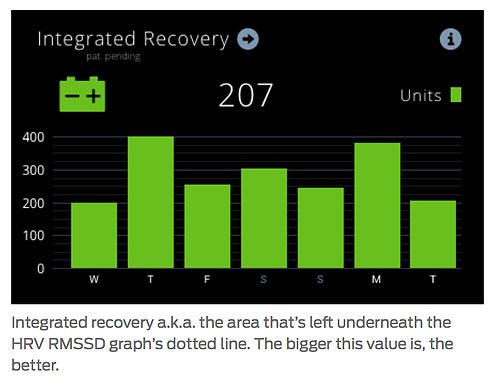
Integrated Recovery is the area that can be seen under the HRV RMSSD graph. It is an indicator for how much recovery you’ve gotten during sleep. For example, some people may start to recover very nicely (RMSSD graph shooting upwards) in the first hours of the night, after they go to bed and fall asleep. But towards the morning hours they may start to become anxious (for example because of work stress) and their RMSSD starts to decline. As a result, the morning RMSSD may be quite low when compared to the evening RMSSD, thus indicating poor recovery, even though there has been some good recovery during the night. This is where integrated recovery steps in, as it takes this good recovery from earlier in the night into account.
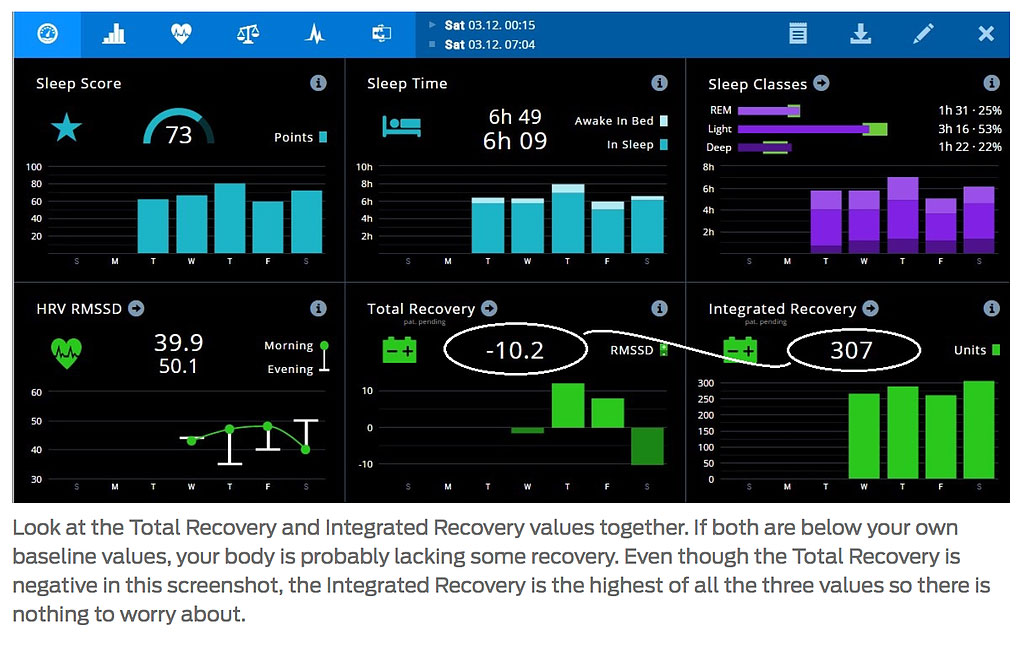
Integrated Recovery and Total Recovery should be looked at as a pair. On the one hand, even if your Total Recovery is low, but the Integrated Recovery is medium or high (with regard to your own history!), some recovery has happened during the night. On the other hand, if both of these values are low, recovery is probably not sufficient. In this case you should avoid straining yourself too much by for example avoiding hard workouts.
ANS Balance
Autonomic Nervous System Balance tells whether you’re too excited (high LF value) or too phlegmatic (high HF value)*. The diagram displays both LFn and HFn**. What you need to remember here is that ideally, the indicator should stay near the 50-50 shaded line between values of 25 and 75. Deviation beyond 25-75 or 75-25 line may be a sign of insufficient recovery, high or chronic stress, general fatigue or some other malfunction in your body.
* LF and HF refer to Low Frequency and High Frequency, respectively, and they both are common frequency domain measures of heart rate variability. LF is the area measured in a frequency band of 0.04-0.15 Hz. It is considered a state indicator of both sympathetic/parasympathetic nervous systems. HF is the area measured in a frequency band of 0.15-0.4 Hz. It is considered a state indicator of parasympathetic nervous systems.
** In our system we use normalized units LFn and HFn. The normalized units have been expressed as a percentage of the sum of LF+HF, i.e. LFn=LF/(LF+HF).
Trends
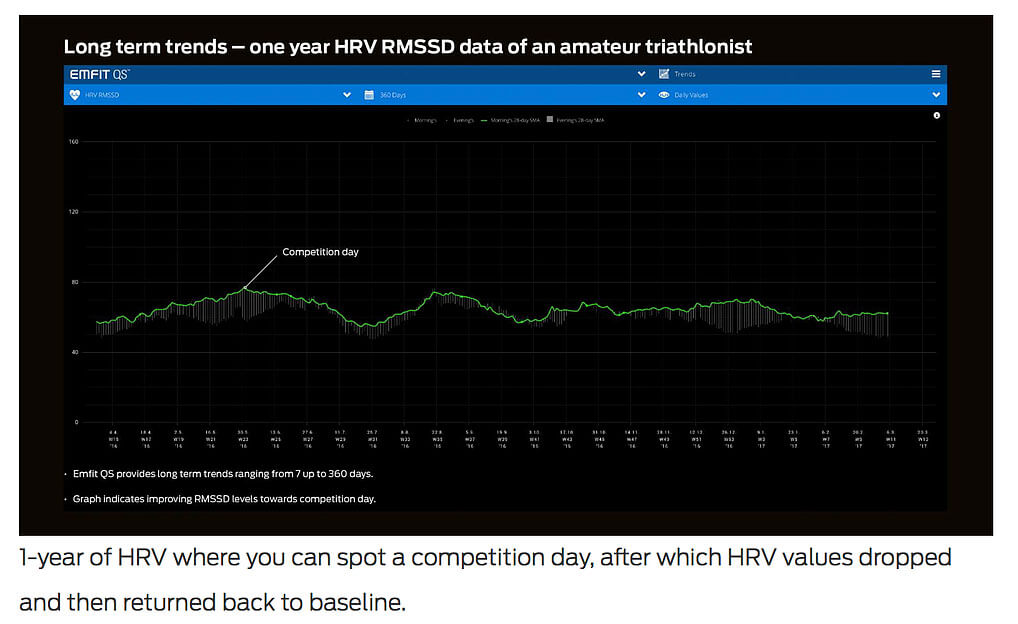
1-year of HRV where you can spot a competition day, after which HRV values dropped and then returned back to baseline.
This is one of my favorite parts of Emfit QS. Trends are great for tracking your own progress. I think it’s exciting to look back to your data and see what kinds of effects training has had. A steadily rising HRV throughout a long period of time hints about an improvement in your health and physical condition. All that hard work was not for nothing. A steady, declining trend with no ups whatsoever on the other hand is a warning sign. Watch out: you might be wearing yourself out, slow down before it’s too late!
Wrap Up
Well this has been quite a big chunk of info. I want remind you that our recovery graphs are kind of connected and it’s important to look at them as a package. Another important issue to remember is that HRV data is very individual. There is no use of comparing your own values to someone else’s. Measure your HRV until you start to see your own baseline and make conclusions based on changes to that level. Hope this was useful and helps you leverage your HRV data!
XX,
Peppiina